skip to Main Content
0845 899 4444
sales@makers.biz
Makes the difference
0845 899 4444
sales@makers.biz
Open Mobile Menu
Home
About Us
The Company
Our People
Association Membership
Partnering
Supply Chain Partners
Accreditations & Certifications
Policies & Procedures
Guarantees
Services
Concrete Repairs
Cathodic Protection
Roofing Refurbishment
Structural Refurbishment
Car Park Refurbishment
Testing & Investigation
Lighting Schemes & Design
Movement Joints
Project Budgets
Continual Professional Development (CPD)
Testing, Investigation & Diagnosis to Concrete Structures
Concrete Repair & Protection
Expansion Joints
Liquid Roofing & Applied Coatings
Lifecare Planning for Multi-Storey Car Parks
Case Studies
Testimonials
Awards
Health & Safety
News
Careers
Construction Site
Management Training
Programme
Vacancies
Contact Us
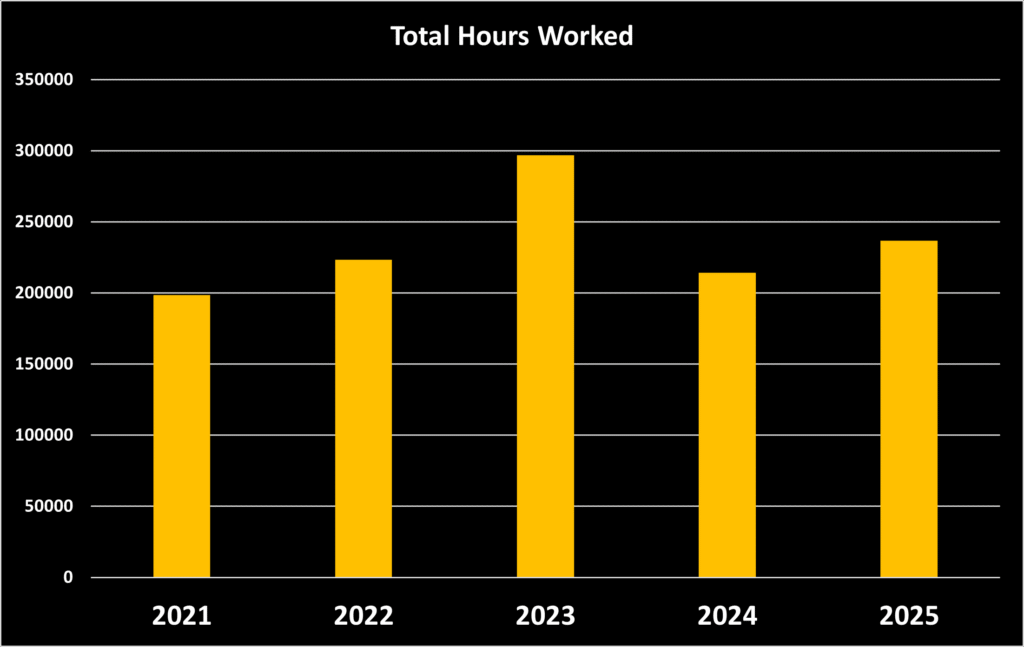
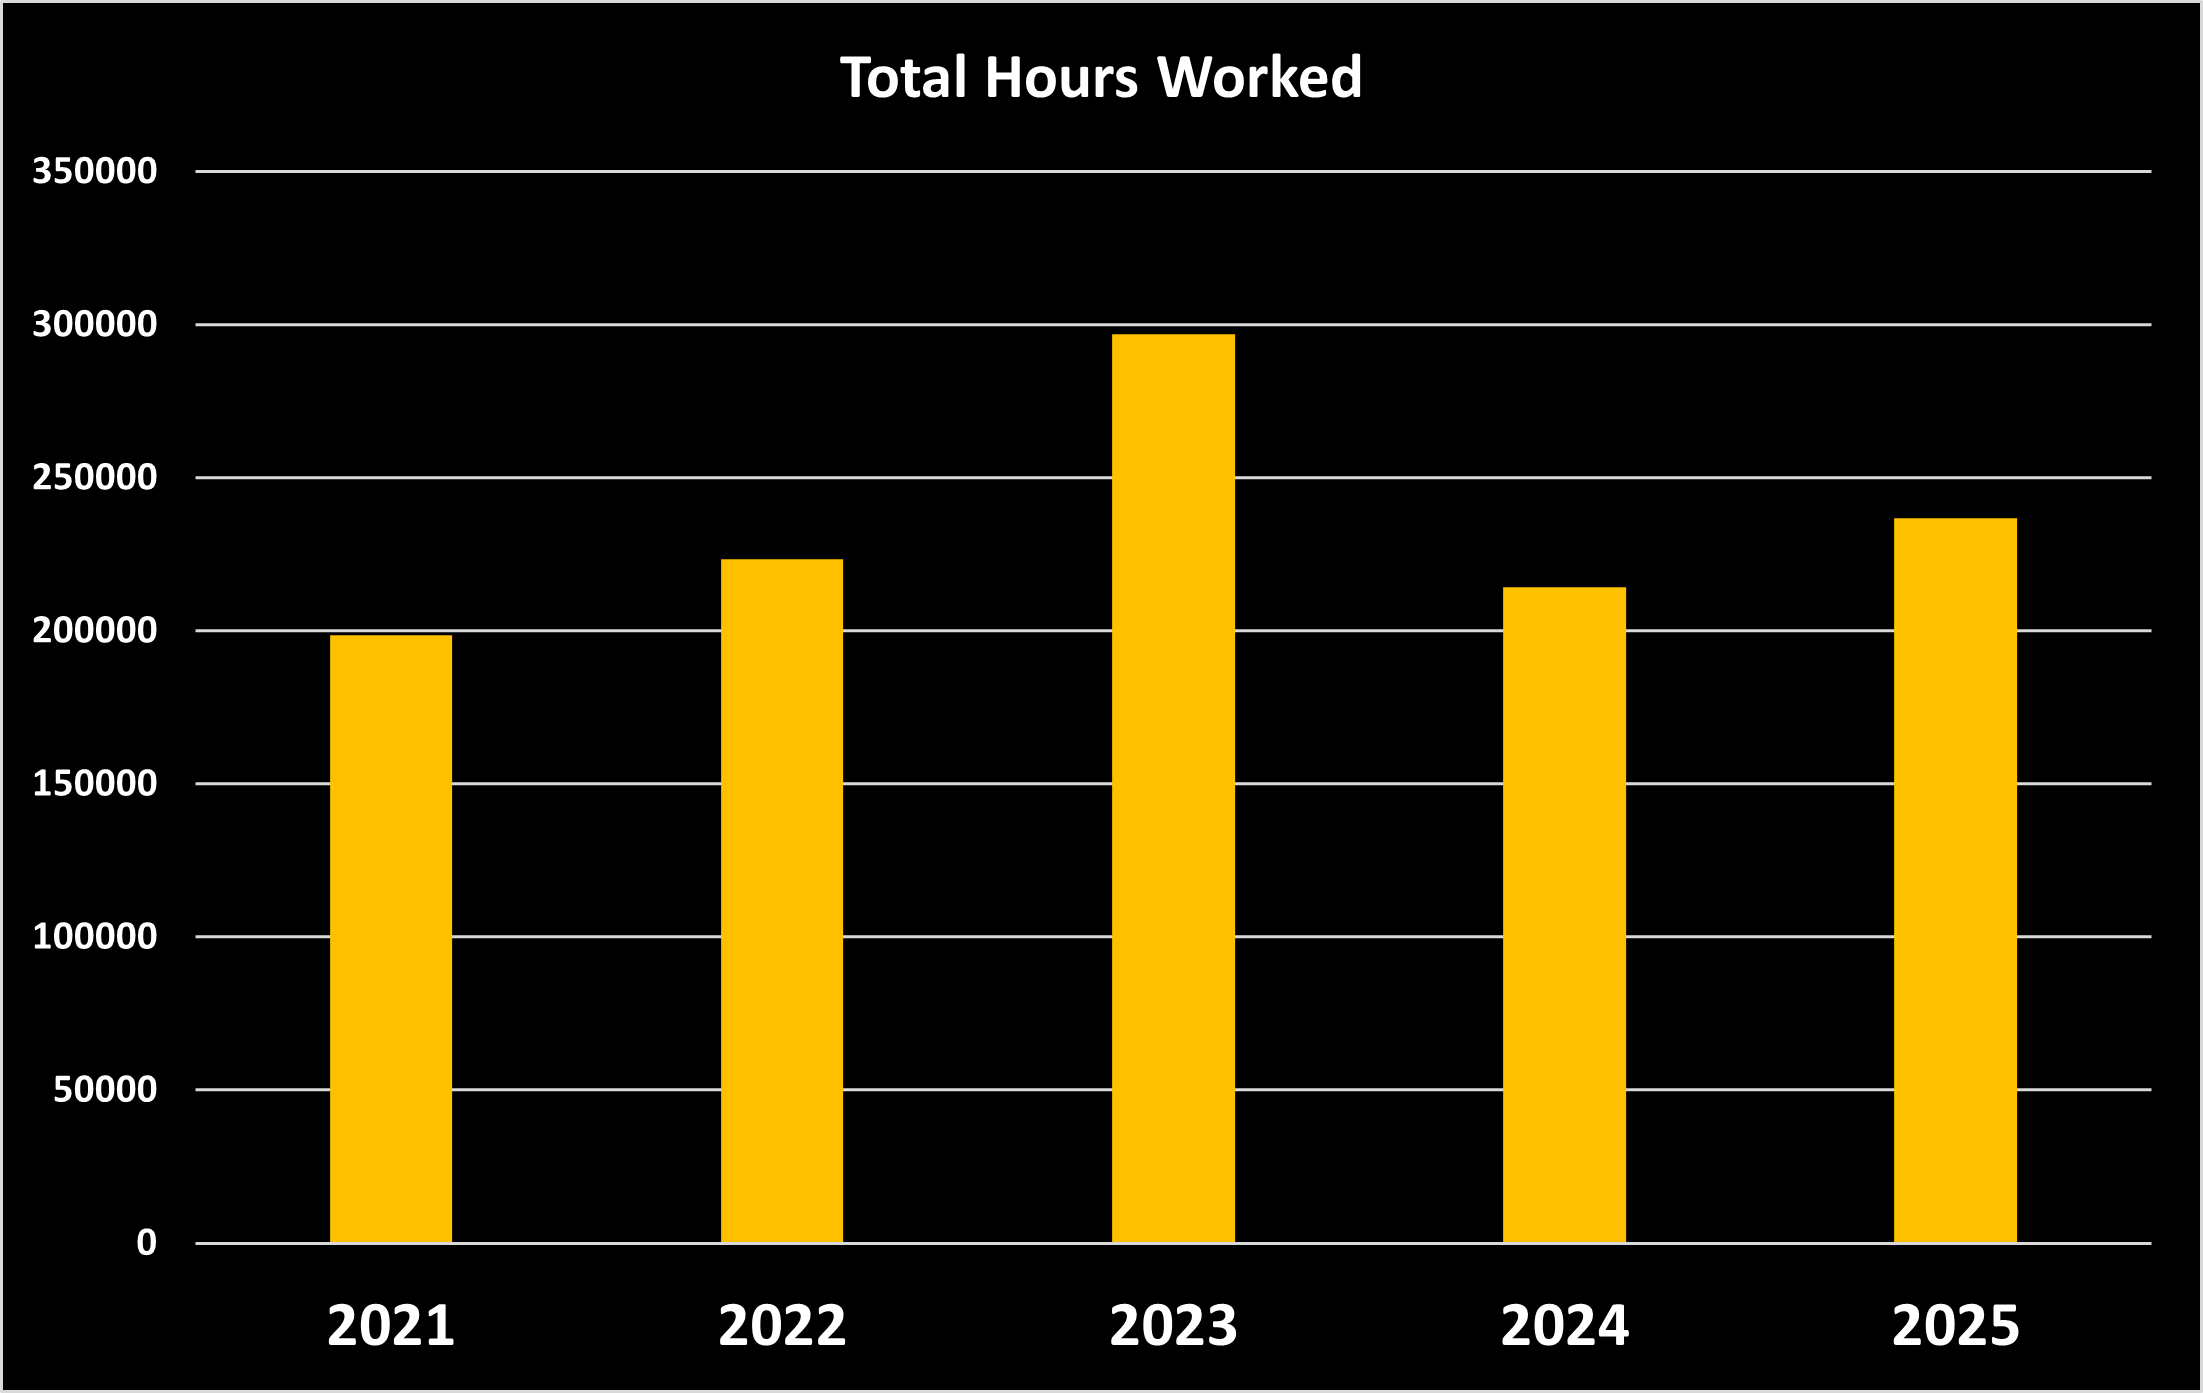
2025 hours worked graph
A bar chart graph showing the amount of hours worked throughout the years from 2021 to 2025
Back To Top
×